CARBON STORY
The Global Carbon Project is a scientific program that aims to draw a
complete picture of the carbon cycle on planet Earth.
Take a short tour of our carbon story.
ENTER
THE PAST
Investigate human progress through history and the human impact on the carbon in the atmosphere
ENTER
THE PRESENT
Discover when, where and by whom carbon dioxide is emitted
ENTER
THE FUTURE
Think about the climate that you would choose for your future


Analyse the present
HUMAN IMPACT
SO FAR
SO FAR
Measured as the cumulative emissions of CO2 from all human activities since the beginning of the Industrial Period
GtCO2
YOU ARE HERE

800,000BC700,000BC600,000BC500,000BC400,000BC200,000BC100,000BC15,000BC19002013
800,000BC700,000BC600,000BC500,000BC400,000BC250,000BC150,000BC100,000BC15,000BC19002013
800,000BC700,000BC600,000BC500,000BC350,000BC200,000BC100,000BC50,000BC15,000BC19002013
Industrial Era
800,000BC400,000BC100,000BC1900195519952013
800,000BC350,000BC176018501890190019301955197519952013
800,000BC600,000BC400,000BC200,000BC1770187019001930196019802013
Pre-industrial Era


Visualizing human impact
SO FAR
IN 2024


= 5 GtCO2
billion tons of Carbon Dioxide
(cumulated emission in human history)= 100 MtCO2
million tons of Carbon Dioxide
(human emissions in 2022)Land Use
Change
Change
Coal
Oil
Gas
Cement
Gas flaring
Asia
pop:
4,7 B North America
pop:
516 MEurope
pop:
746 MCentral & South
America
America
pop:
533 MAfrica
pop:
1,51 BOceania
pop:
35 MMiddle East
pop:
382 Min the atmosphere
on land
in the ocean
1870s
1880s
1890s
1900s
1910s
1920s
1930s
1940s
1950s
1960s
1970s
1980s
1990s
2000s
2010s
Since 2020
What now?
More than 2,500 Gigatones of carbon dioxide have been released by human activity in the atmosphere.Take a closer look by choosing a question above.
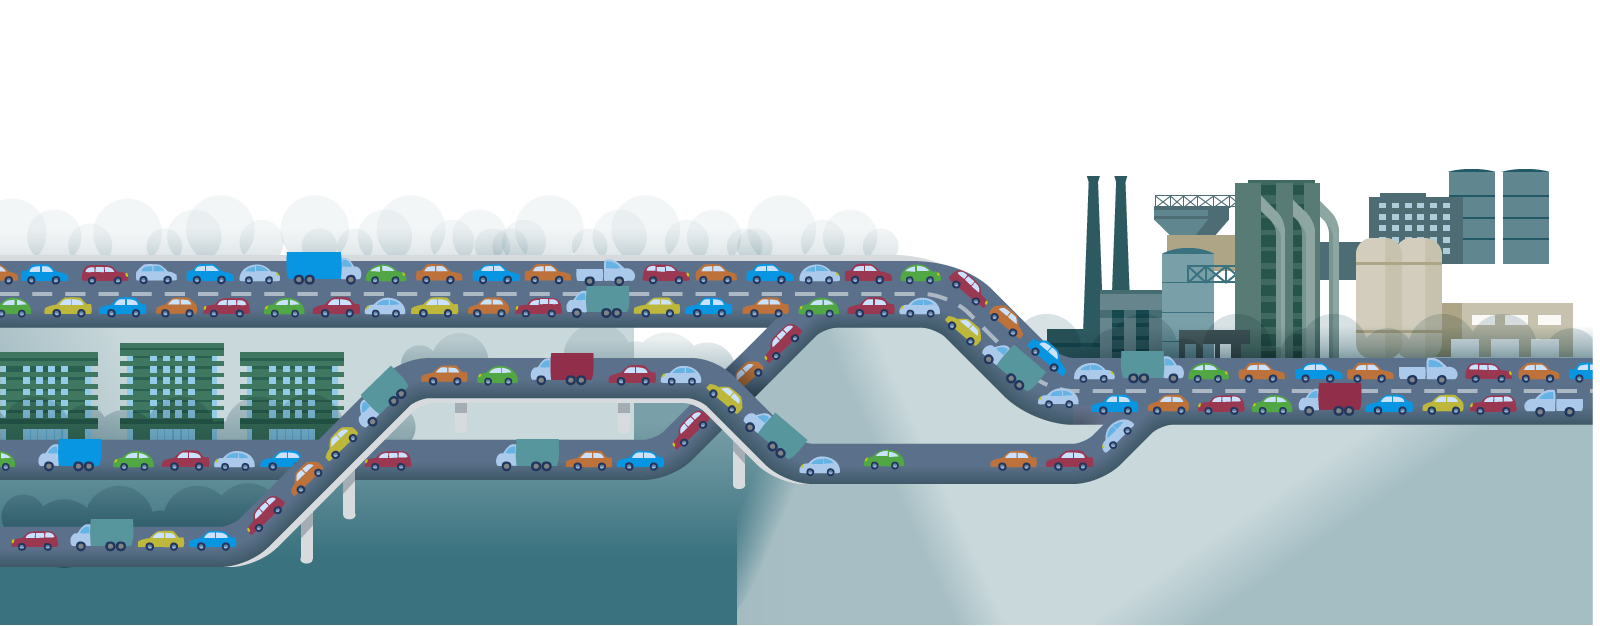
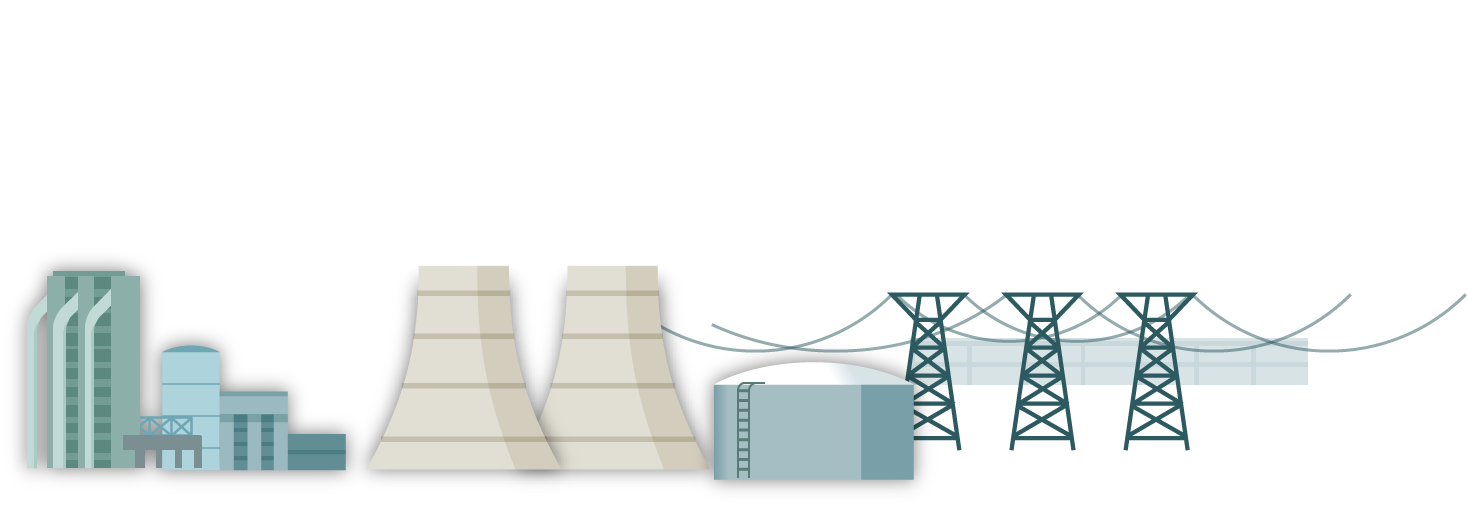
Carbon dioxide emissions are from two major sources. The burning of fossil fuels (oil, gas, coal) is responsible for 2/3rd of the emissions of carbon dioxide since the beginning of the Industrial Revolution. The second source comes from the conversion of land, mainly from forests to pastures and croplands.
In 2022, 35 Gigatonnes of carbon dioxide were released from the burning of fossil fuels (oil, gas, coal) and cement production representing 9/10 of the carbon dioxide emissions from human activities. The remaining comes from the conversion of land.
North America and Europe are responsible for half of all carbon dioxide emitted since the beginning of the Industrial Revolution. The emerging economies of China and India account for 14%, while the rest comes from the remaining 150 plus countries.
With 4 billion people, Asia is today the biggest emitter followed by North America and Europe. Europe and the USA are responsible for over 10% of the emissions while China and India account for about 40% of all emissions. Emissions per capita in developing countries are only a fraction of those in the developed world.
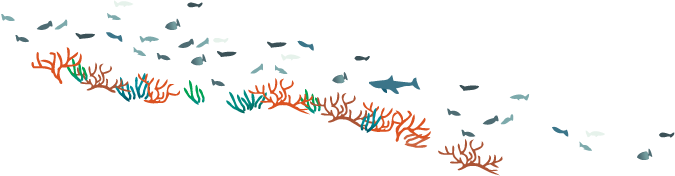
Only half of all emissions of carbon dioxide from human activities have remained in the atmosphere, leading to warming of the planet and other climate changes. The rest of emissions has been removed in equal parts by the ocean and land (vegetation and soils), and thus slowing down greatly the pace of climate change.
Both the ocean and land are continuing to remove emissions. Year-to-year variations are the largest on land, with some years being the most important cleaner of atmospheric carbon dioxide while others contributing little.
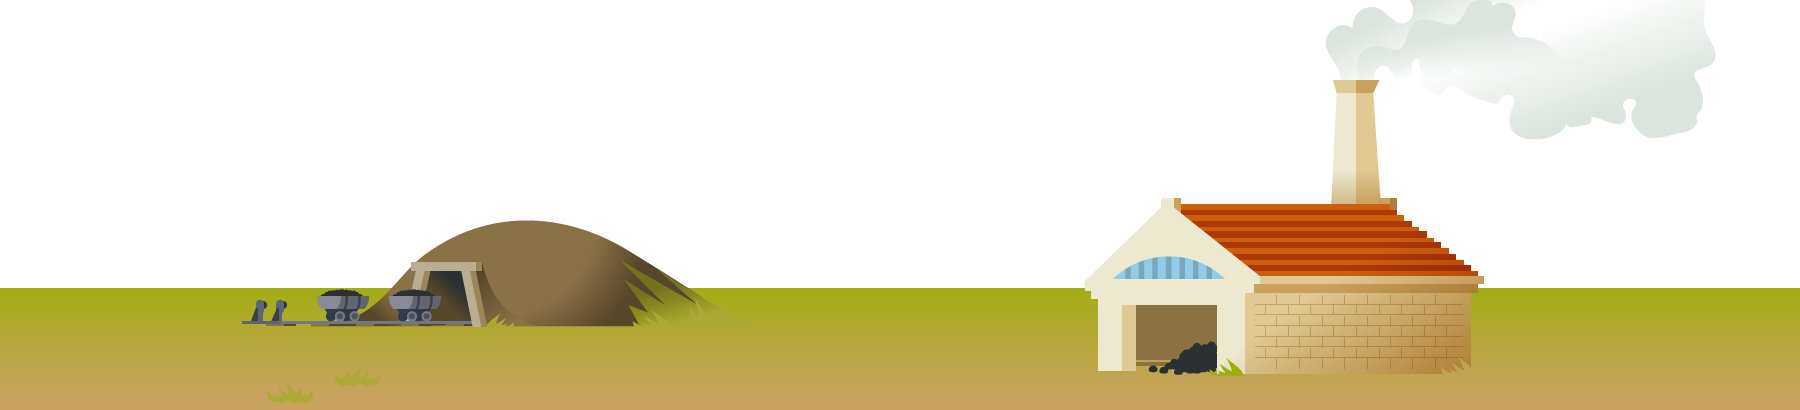
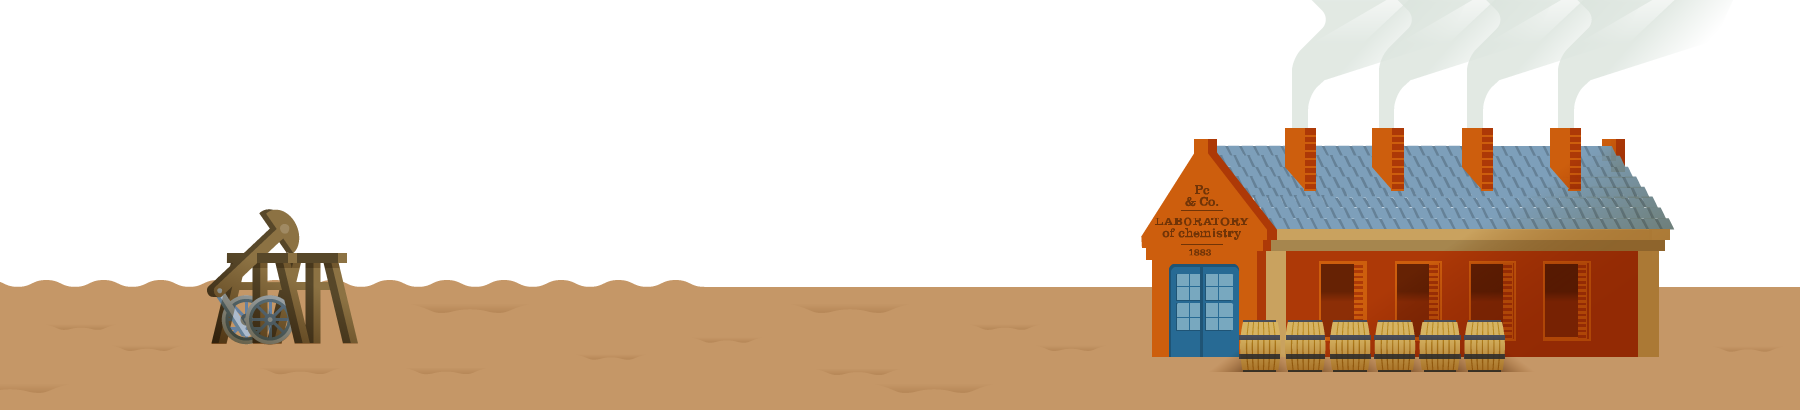
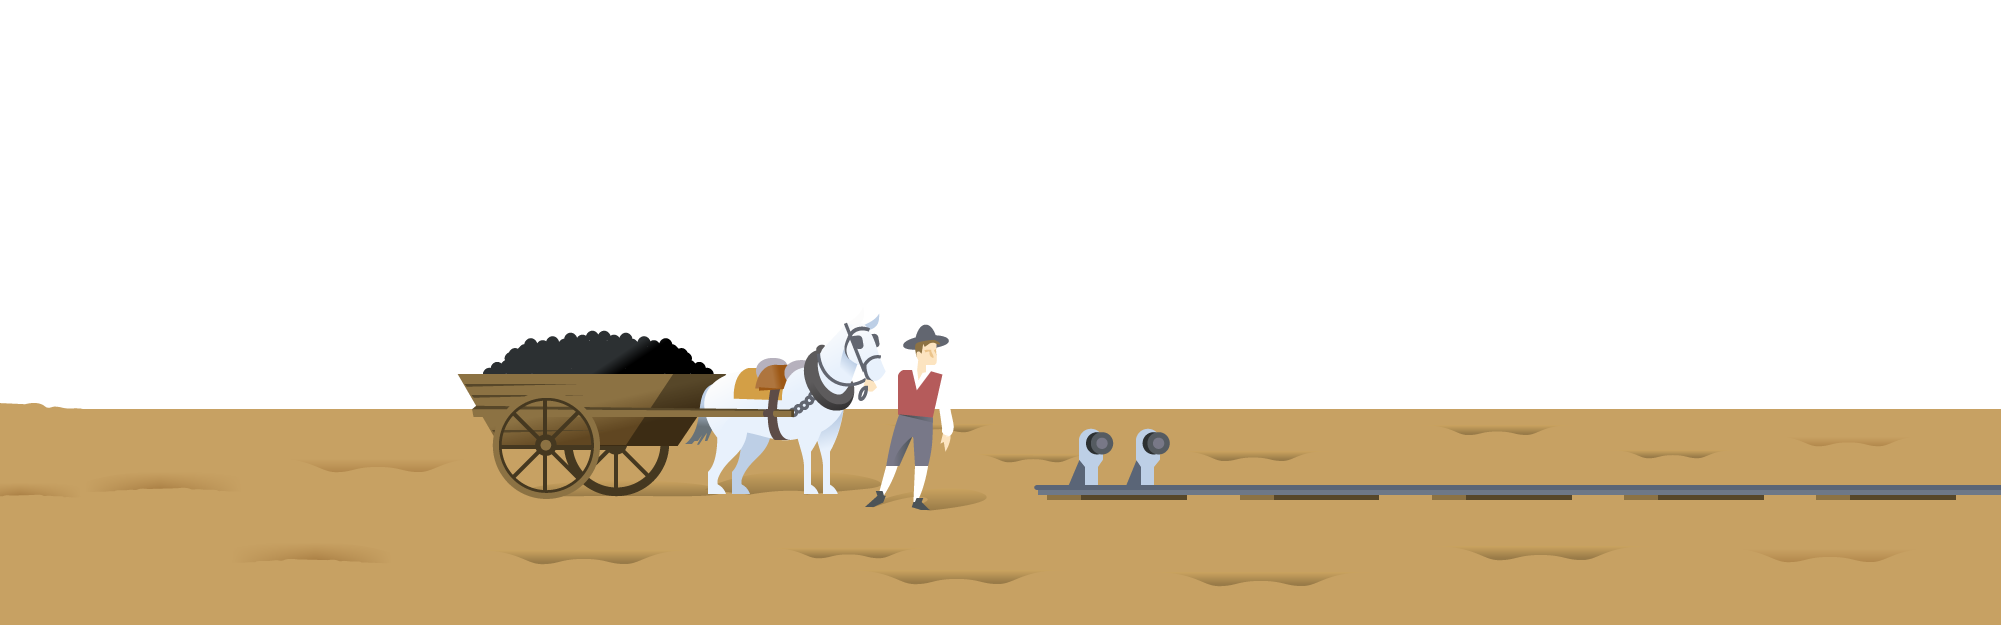
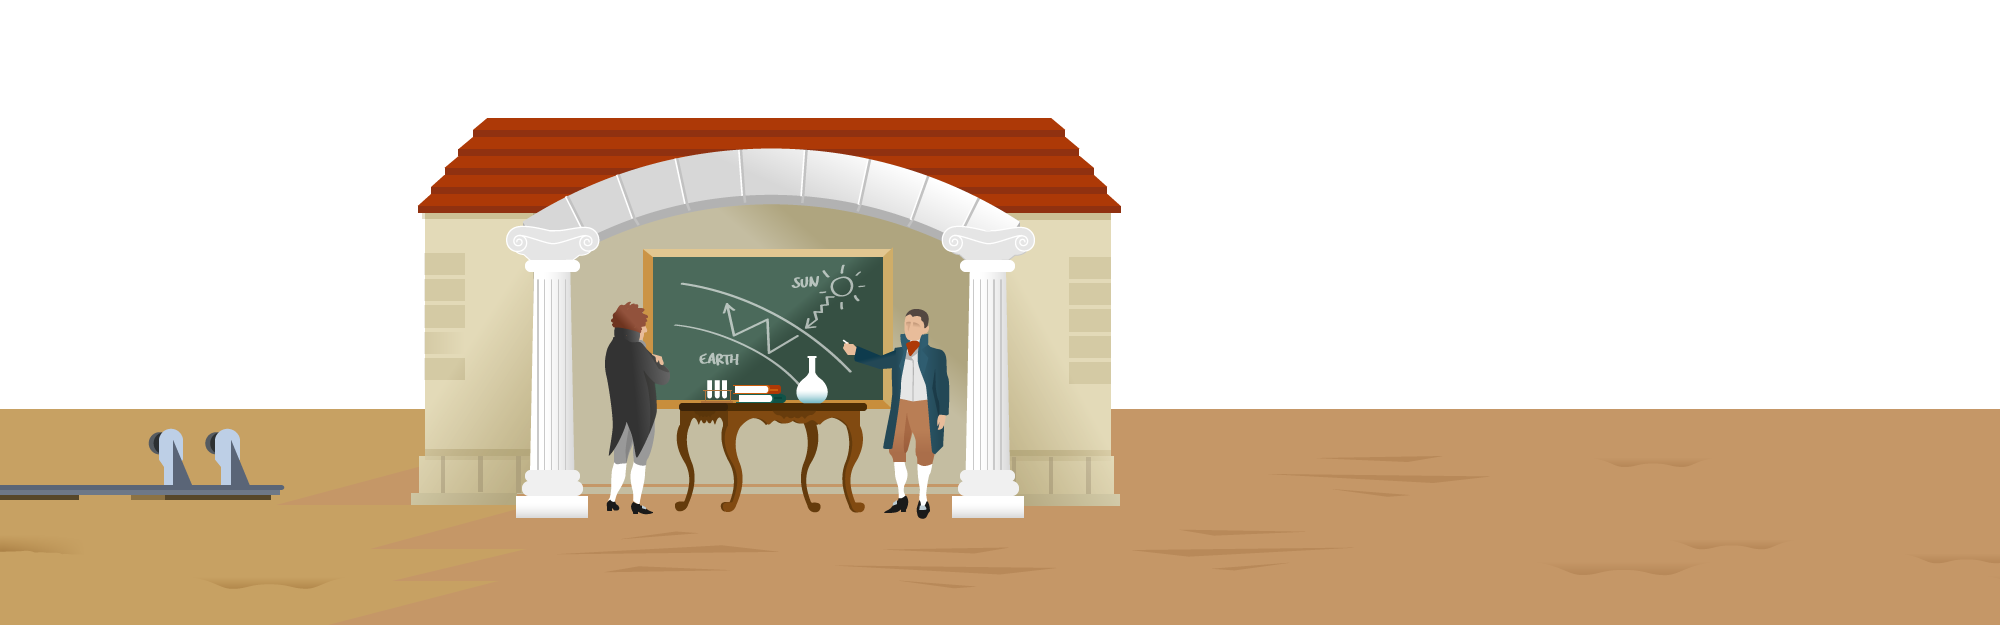
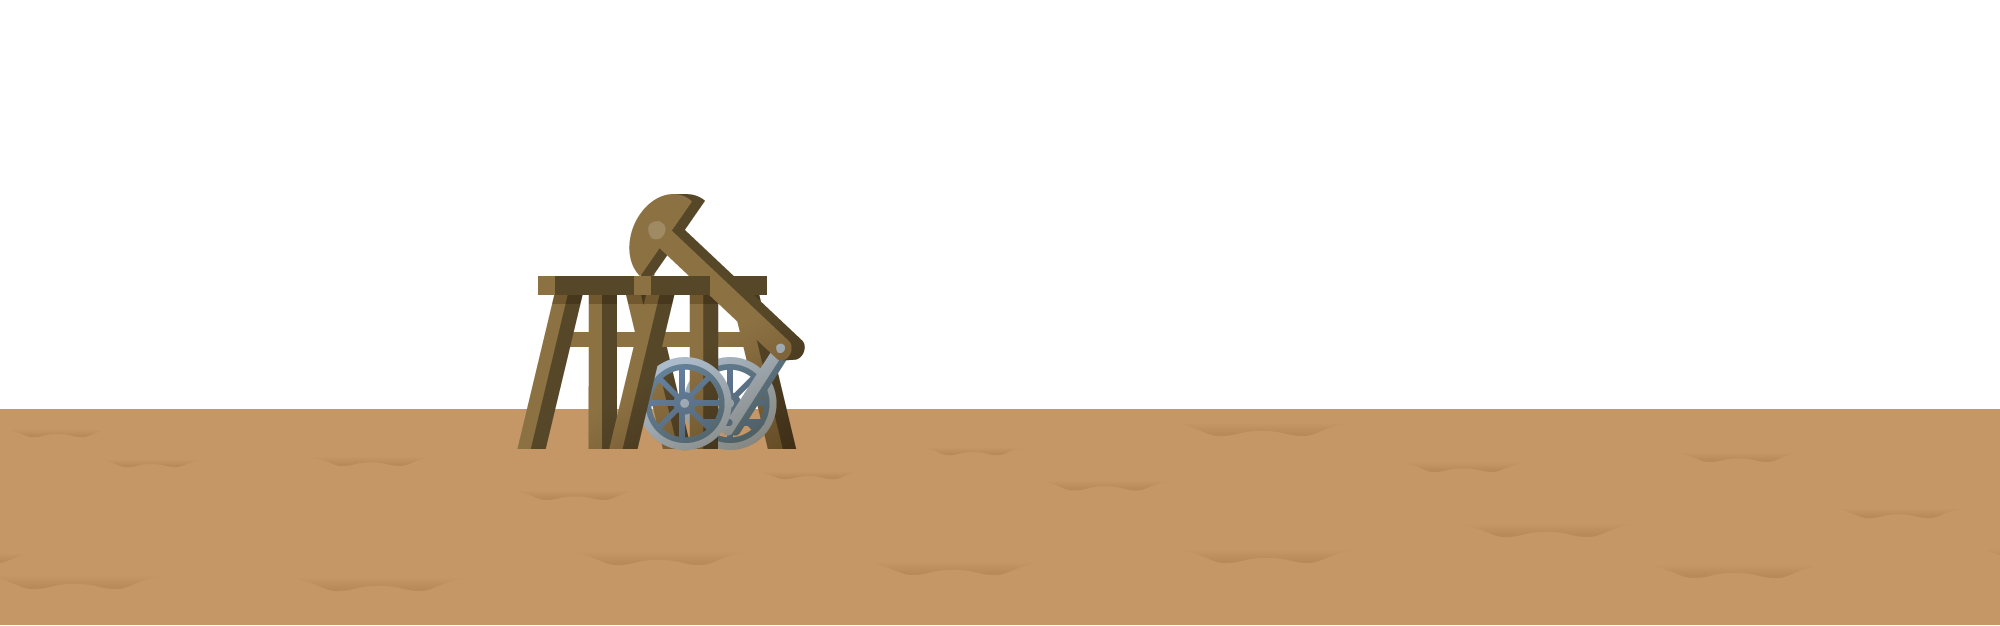
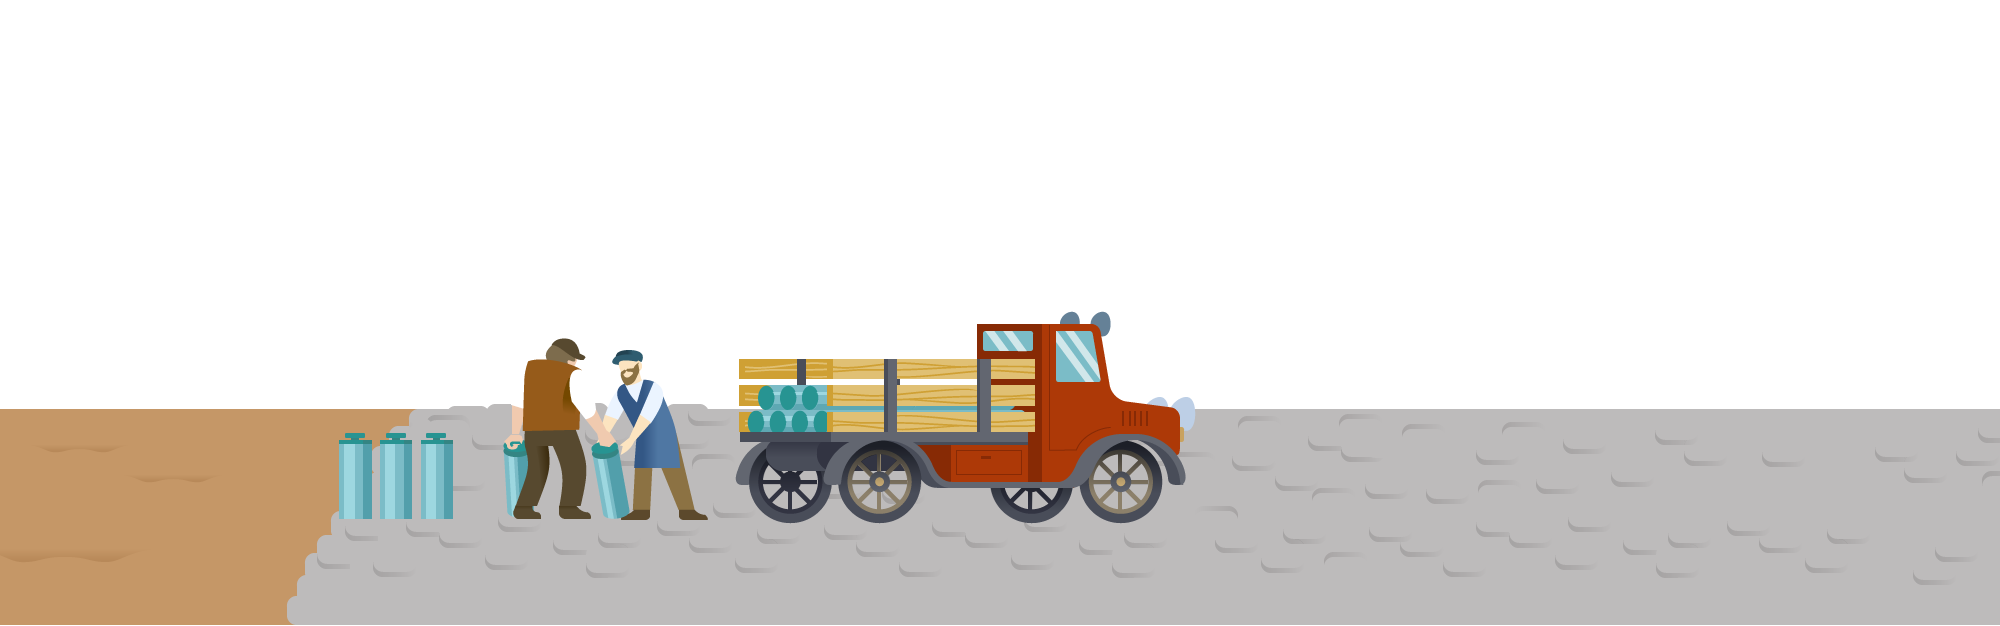
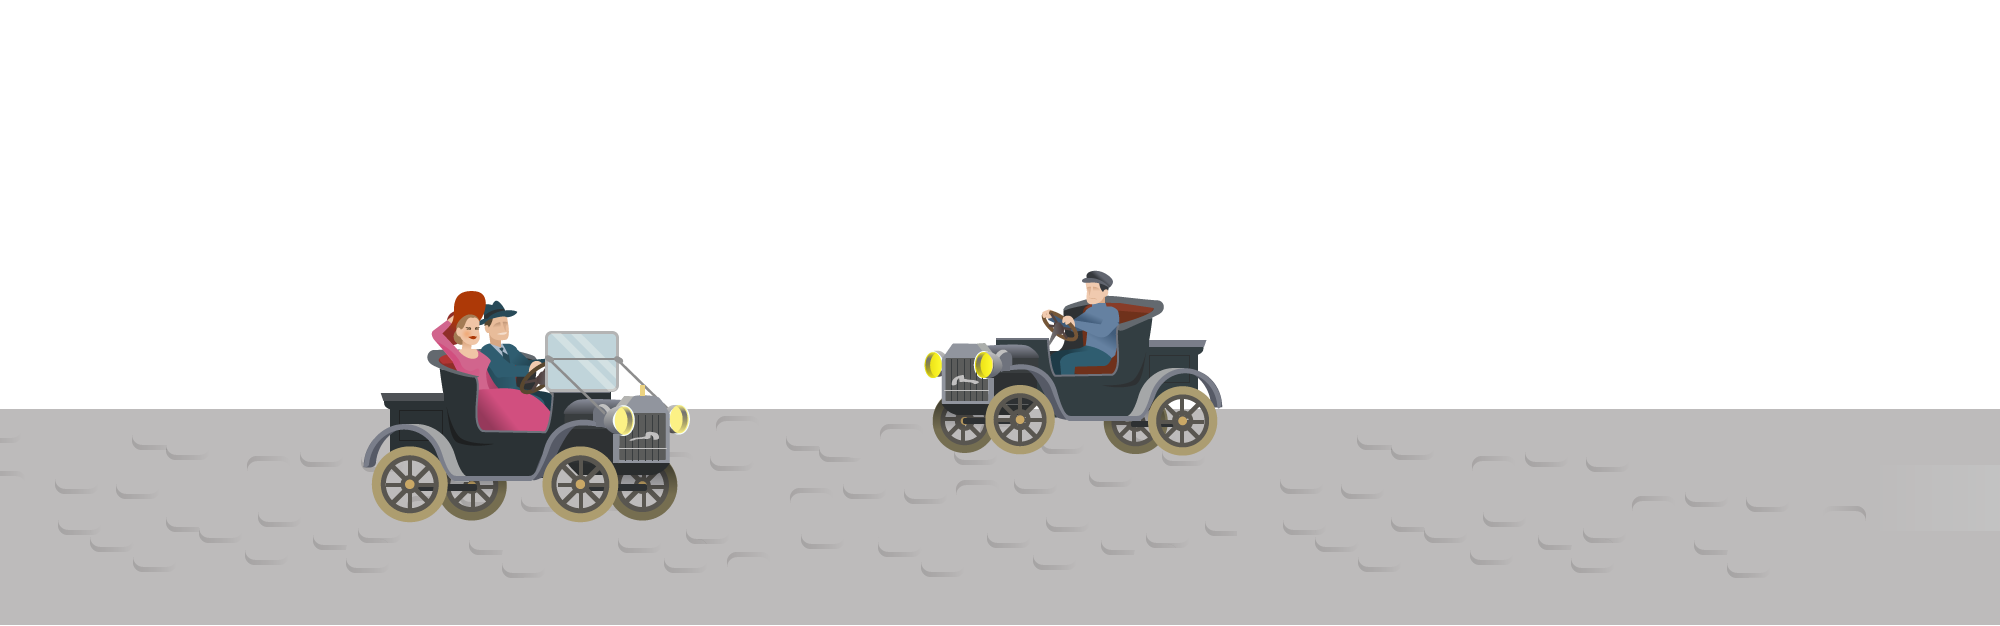
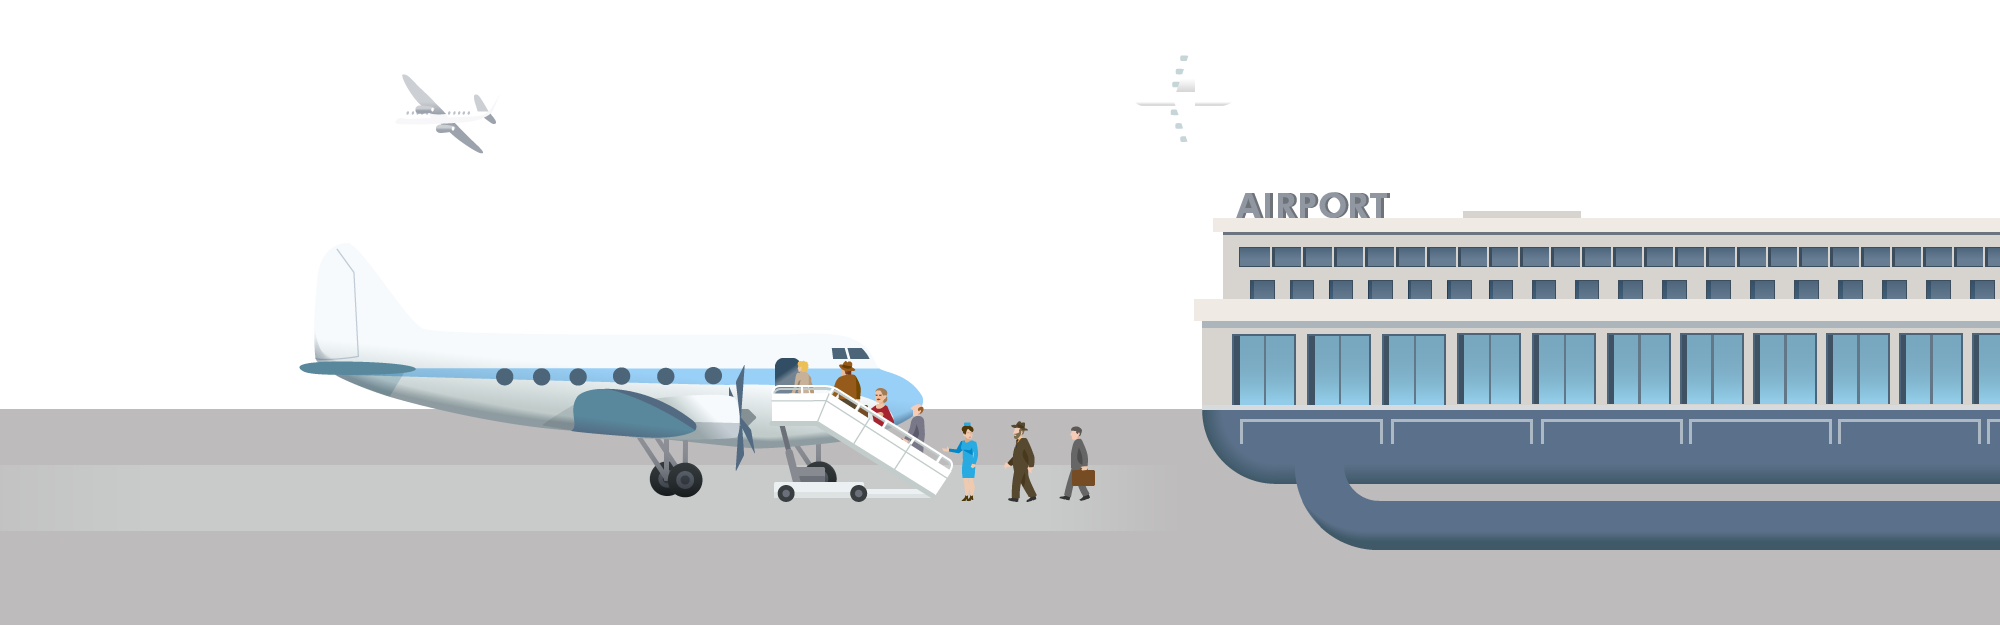
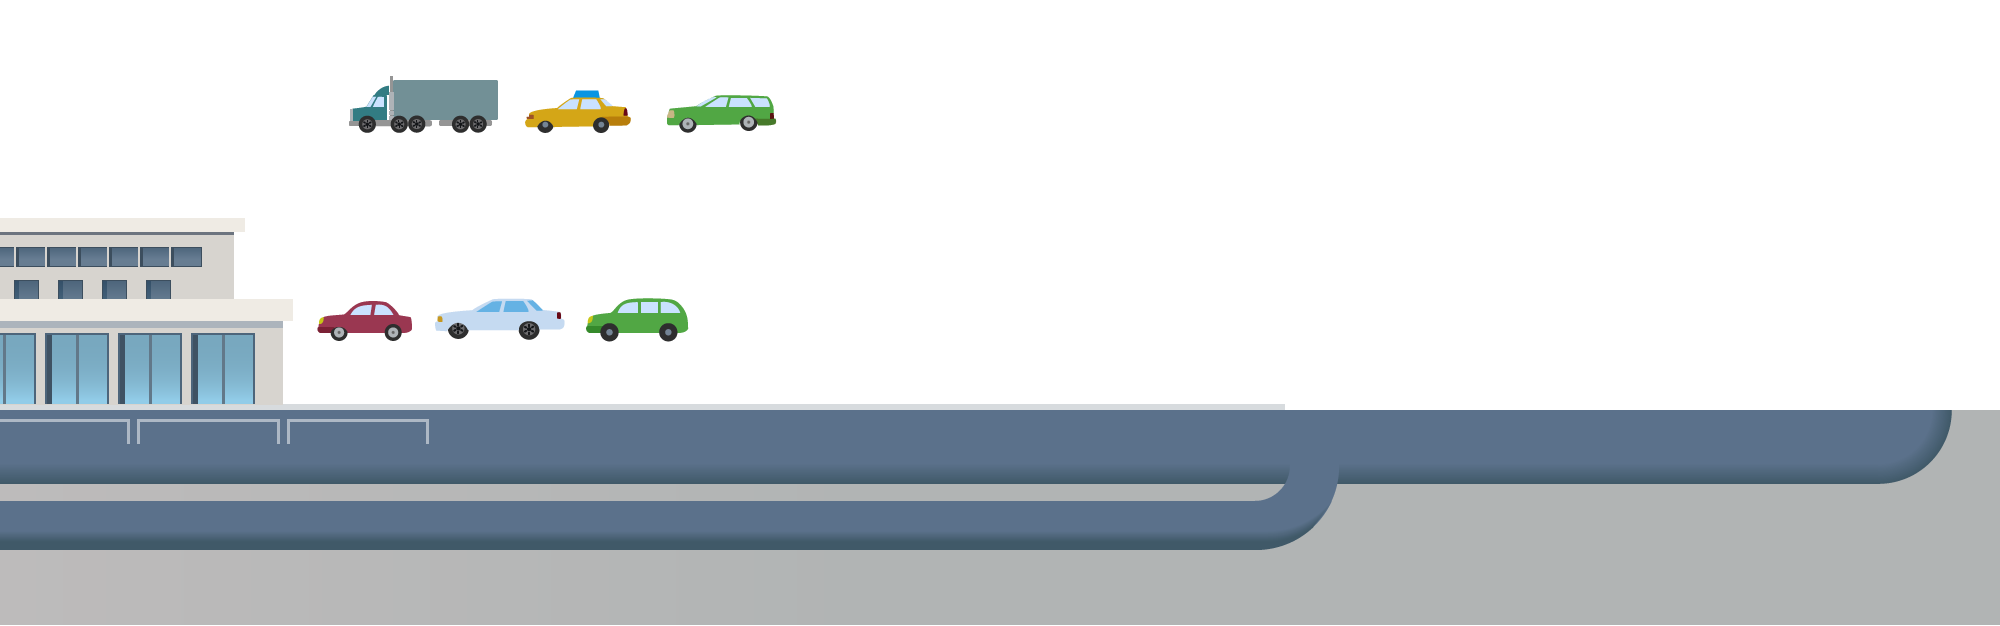
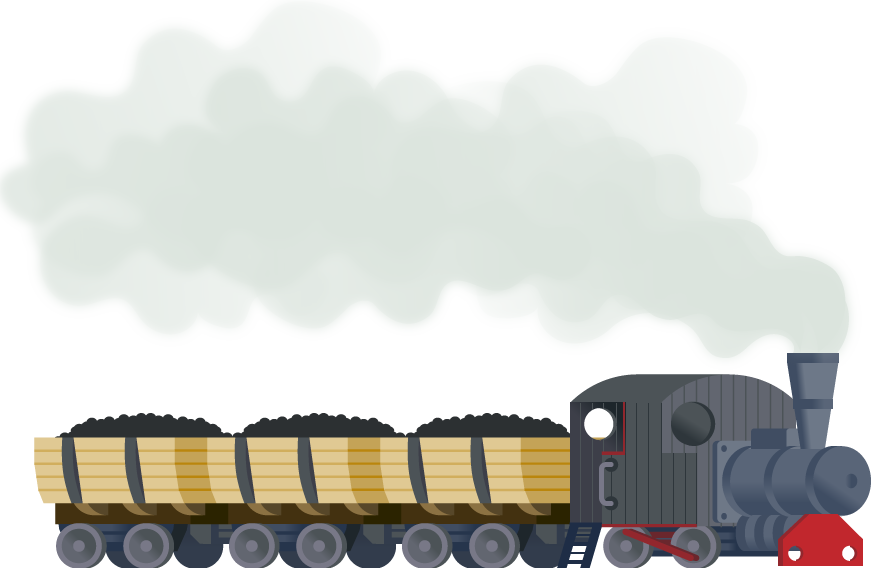
Humans have a long history of releasing carbon dioxide to the atmosphere through multiple activities, beginning with deforestation. Around 1750, the industrial revolution began with the invention of steam power, launching an era of unprecedented carbon dioxide release into the atmosphere. With the industrial use of fossil fuels, first coal, then oil and gas, emissions have grown exponentially.
What's next?Take a look at the future
What's next?
The scientific community have joined forces to explore what the next hundred years may look like.
You can choose your own future by
moving the cursor on the right
+0.9°C to 2.3°C
Average global temp increase from pre-industrial levels in °C (0.5F° to 1.3F°)
Consequences on


Choose the concentration of CO2 for year 2100


